Summary
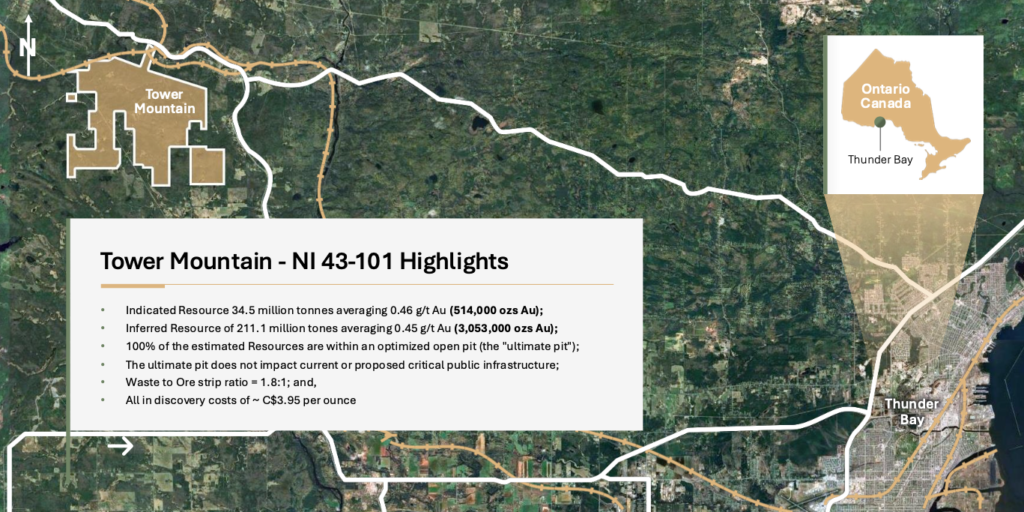
Tower Mountain is located adjacent to the Trans-Canada highway, approximately 40 km west of the international port city of Thunder Bay, Ontario (pop. 110,000).
Project to date drilling totals 235 holes for approximately 47,000 metres.
Micon International Limited estimated a mineral resource of:
Category | Tonnes (Mt) | Grade (Au g/t) | Contained Metal (‘000 oz Au) |
Indicated | 34. | 0.46 | 514 |
Inferred | 211.1 | 0.45 | 3,053 |
MRE Notes:
1. The effective date of this MRE is January 19, 2026.
2. Messrs. William Lewis, P.Geo., Charley Murahwi, P.Geo., FAusIMM, and Tudorel Ciuculescu, P.Geo. from Micon International Limited are the Qualified Persons (QPs) responsible for this MRE.
3. The MRE has been classified in the Indicated and Inferred categories. At this time, there are no Measured resources at the Tower Mountain Project.
4. The calculated gold cut-off grade is 0.19 g/t Au.
5. An average specific gravity (SG) value of 2.77 g/cm3 was used.
6. The MRE used economic assumptions for open pit mining. The following economic parameters were used for generating the cut-off grade: a gold price of US$3,000/oz, 80% recovery, open pit mining cost of US$3.0/t, processing costs of US$8.0/t, general and administration cost of US$3.5/t, transportation cost of US$2.5/oz of gold, and a royalty of 3%.
7. The open pit used slope angles of 30° in overburden and 50° in fresh rock.
8. The block model is orthogonal and has a parent block size of 5 m x 5 m x 5 m, with minimum sub-block size of 2.5 m x 2.5 m x 2.5 m.
9. The open pit optimization used a re-blocked size of 10 m x 10 m x 10 m.
10. The mineral resources described above have been prepared in accordance with the current Canadian Institute of Mining, Metallurgy and Petroleum Standards and Practices.
11. Numbers have been rounded to the nearest million tonnes and nearest thousand ounces. Differences may occur in totals due to rounding.
12. Mineral Resources are not Mineral Reserves as they do not have demonstrated economic viability. The quantity and grade of reported Inferred Mineral Resources are uncertain in nature and there has been insufficient exploration; however, it is reasonably expected that a significant portion of Inferred Mineral Resources could be upgraded into Indicated Mineral Resources with further exploration.
13. Micon QPs have not identified any legal, political, environmental, or other relevant factors that could materially affect the potential development of the mineral resources and of the estimate.
The Effective Date of the estimate is January 19, 2026.
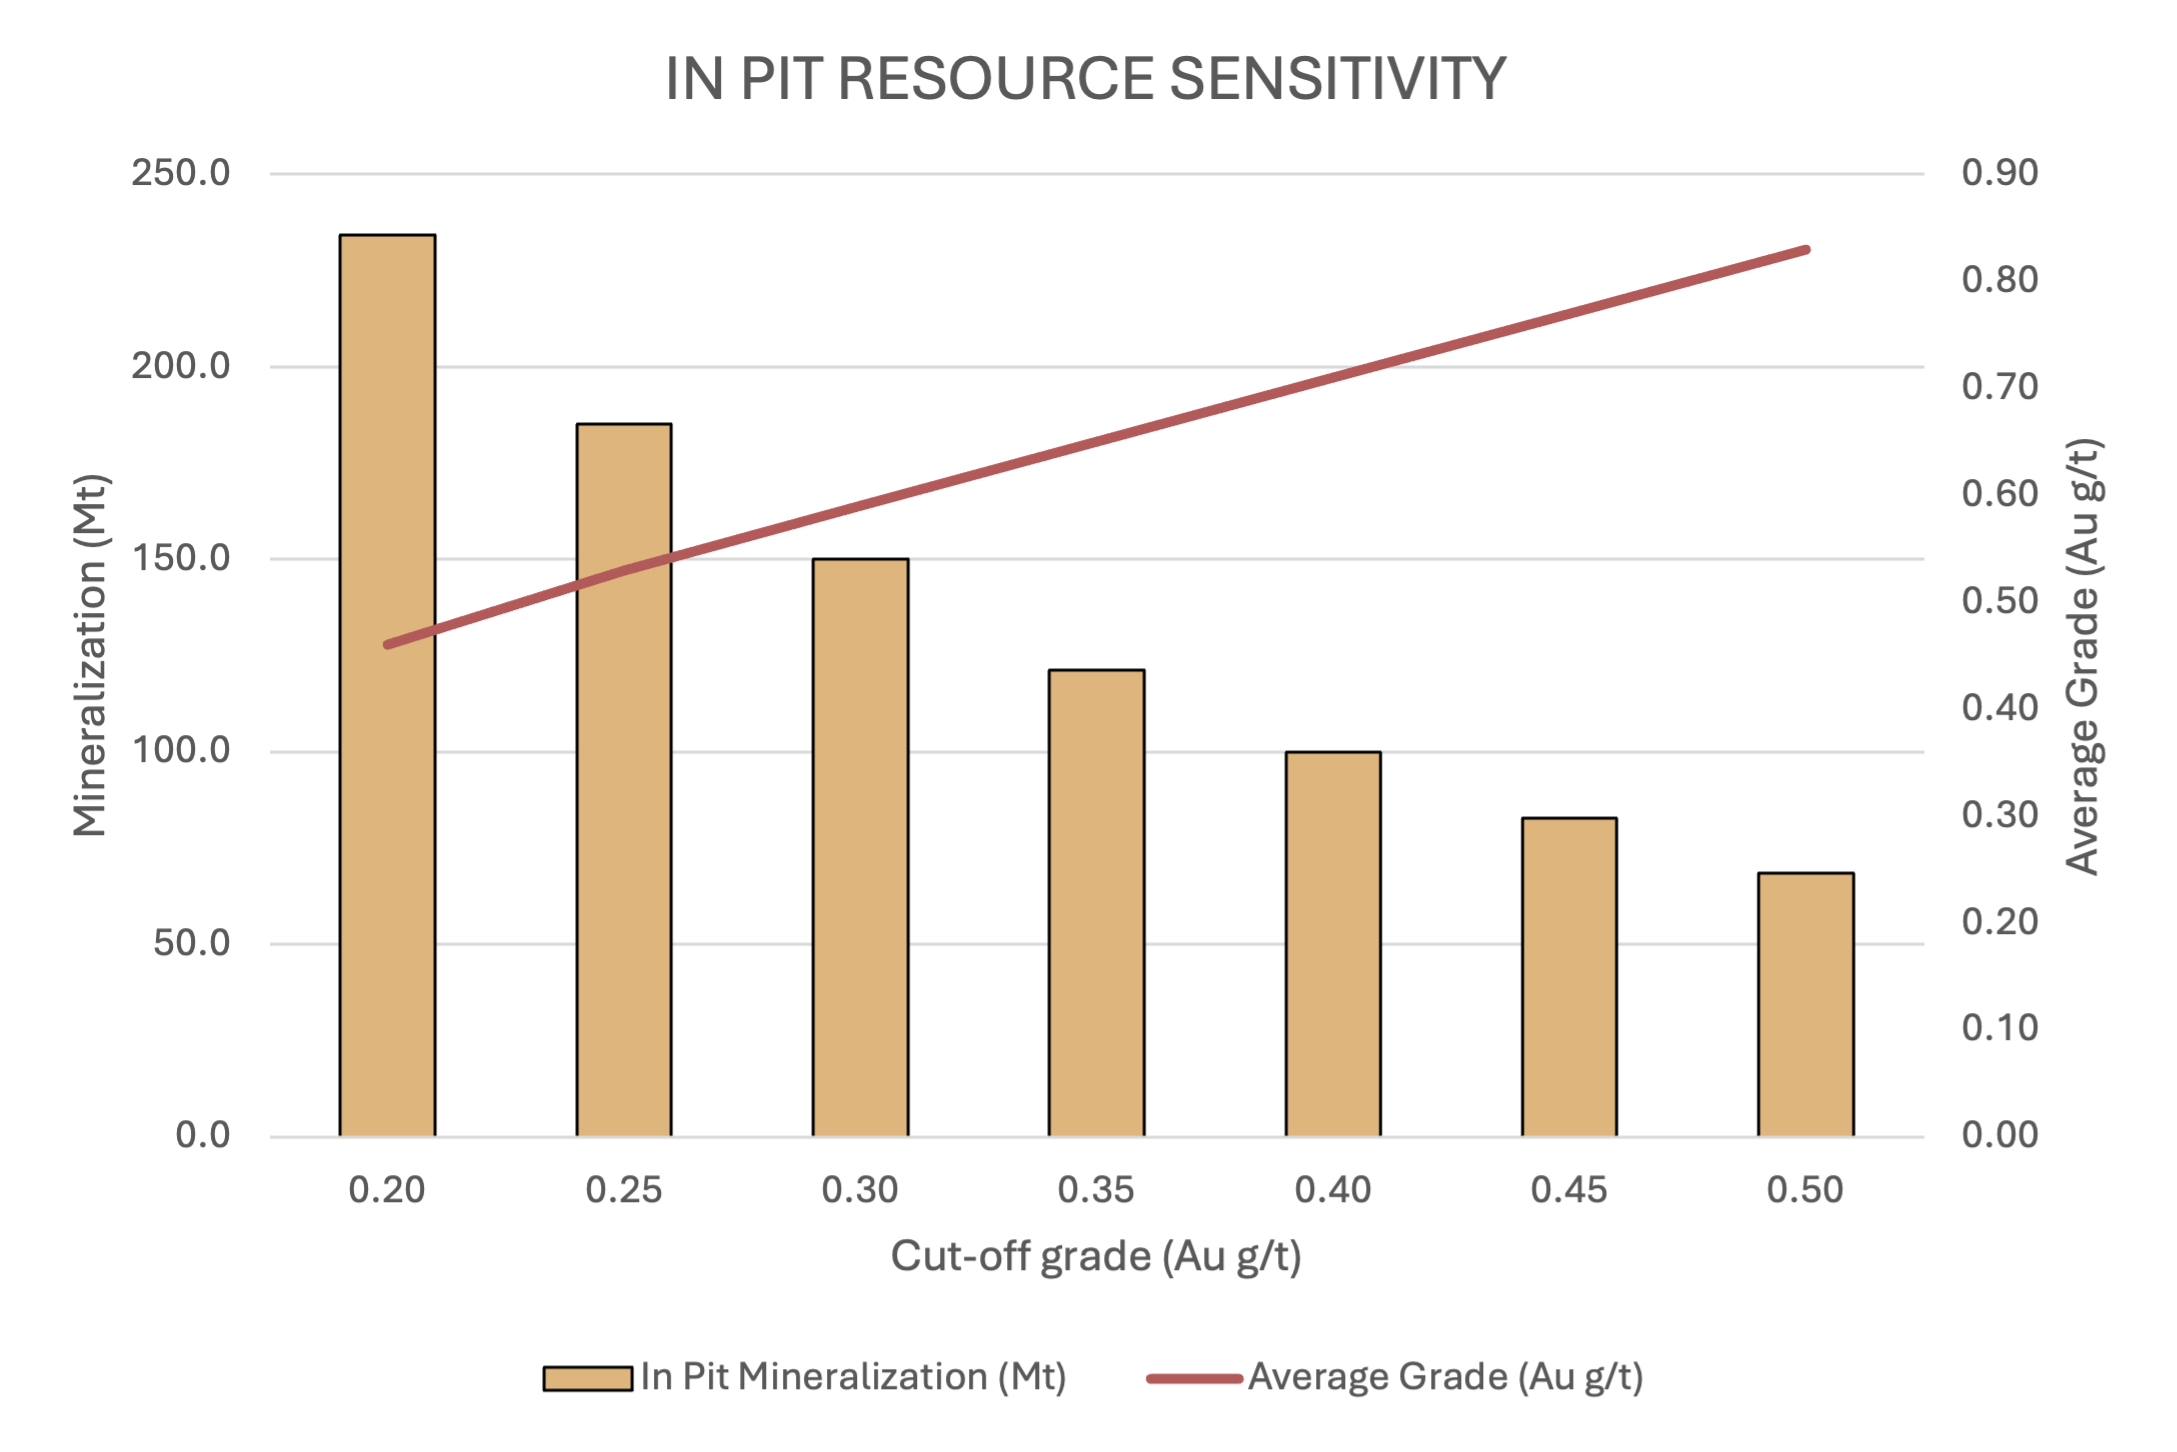
There are opportunities to enhance the average grade of the resource within the current optimized pit shell as demonstrated by sensitivity analysis at various cut-off grades.
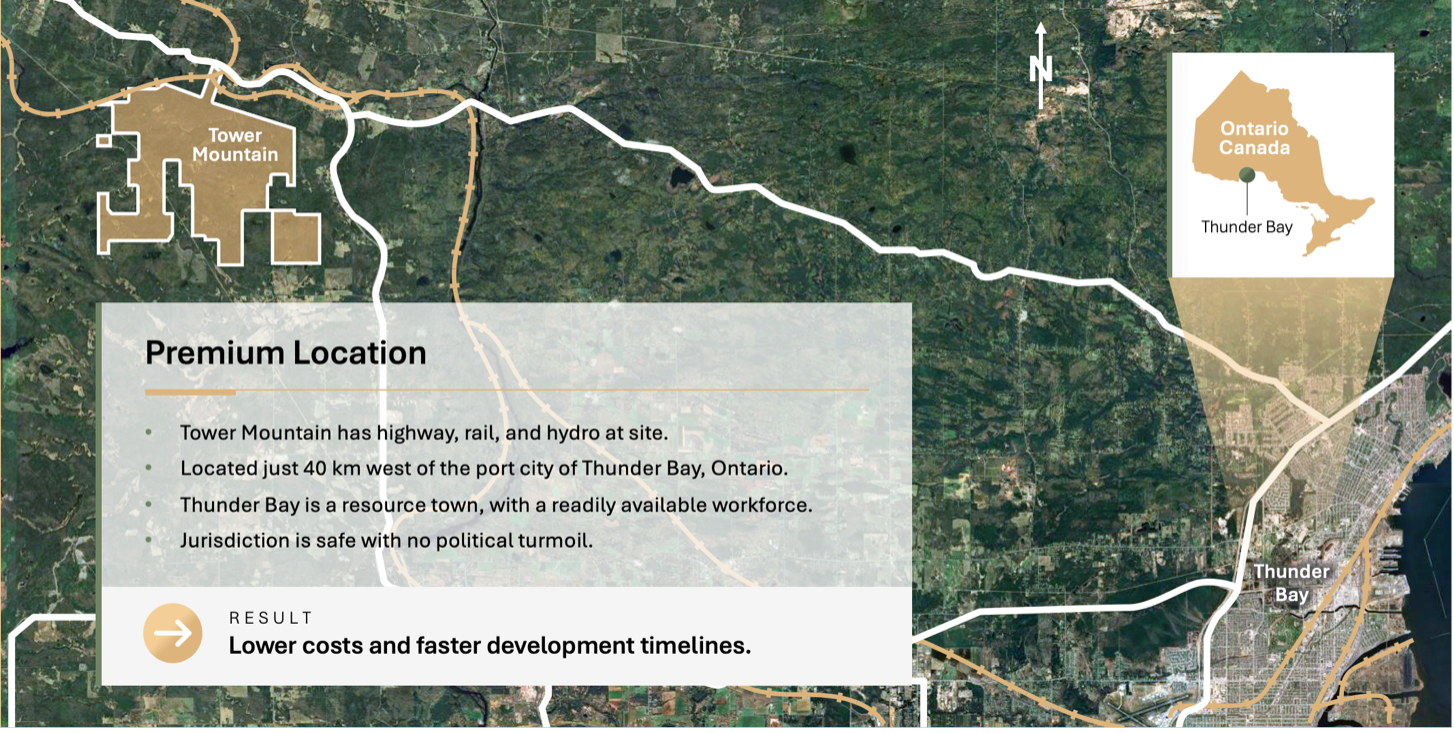
Location Access and Infrastructure
The port of Thunder Bay offers direct access to the Saint Lawrence Seaway.
Year-round access is via highway 11/17 west, the main highway connecting eastern and western Canada. The Property boundary is 3.0 kms south of the highway. Both national railways are easily accessible, and both the current and future east-west hydro transmission corridor are within 3 kms of the current open pit limit.
The proximity to Thunder Bay and built public infrastructure have significant benefits in terms of costs and employee retention. The ability to live and work from home is a significant advantage that few generational mining camps can offer.
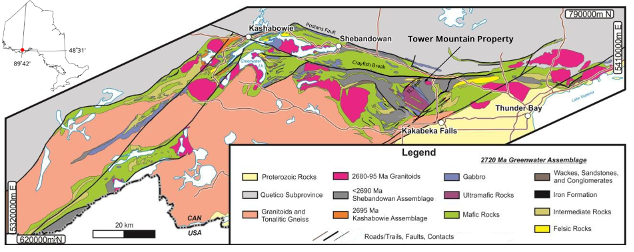
Regional Geology
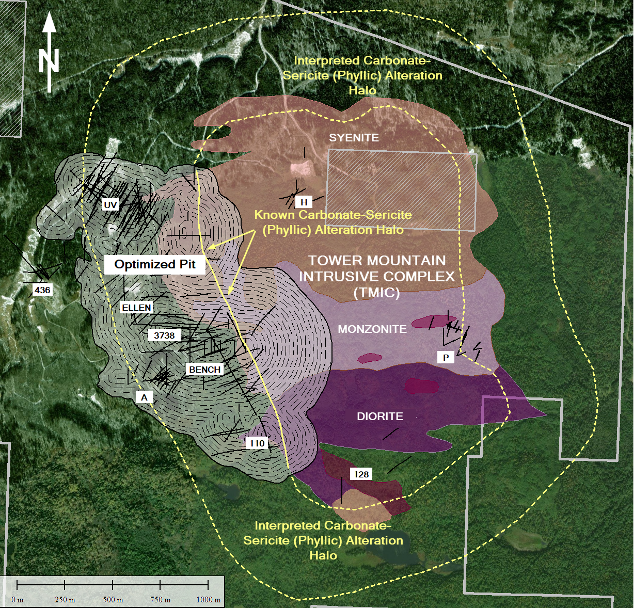
The 7,000-hectare property surrounds the Tower Mountain Intrusive Complex (“TMIC”), the largest, exposed, calc-alkalic intrusive complex in the eastern Shebandowan Greenstone Belt. The Property is comprised entirely of Archean aged volcanic, volcanoclastic and intrusive rocks of the Shebandowan Assemblage.
Local Geology, Alteration and Mineralization
The TMIC is a multi-phase intrusion comprised of syenites, monzonites, diorites and gabbro. The volcanic-intrusive host rocks surrounding the TMIC are variably brecciated and altered, a result of successive magmatic hydrothermal events from 2692 to 2689 Ma.
Carbonate-sericite-chlorite (“CSC”) alteration extends over 500 metres west of the TMIC and remains open to the west. Gold mineralization favours the CSC alteration which is interpreted to be part of a larger telescoped alteration envelop surrounding the TMIC.
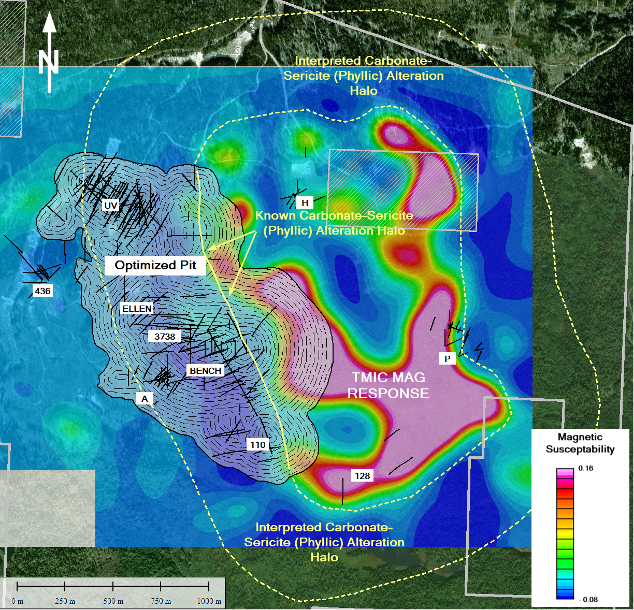
CSC alteration ranges from weak to intense resulting in magnetite destruction and widespread, disseminated pyrite and gold. The magnetite destruction is immediately highlighted by magnetic imagery as broad, intense magnetic lows where alteration is most intense. Magnetic lows surround the TMIC offering a compelling, long-term exploration opportunity to increase the mineral resource of the Property.
Less than 20% of the TMIC perimeter is drill tested, largely limited to the western contact of the TMIC. In 2024, drilling established similar geology and alteration at the P-Target, located along the eastern TMIC contact, 1,500 metres to the east. Grades and interval lengths are statistically indistinguishable from the 47,000 metres defining the current MRE.
The Company’s 2026 Mineral Resource Estimate (“MRE”) is limited to an 1,800-metre-long x 500-metre-wide section of the TMIC contact. CSC alteration extends from the TMIC contact west for at least 500 metres. The exact position is not known due inadequate drill density.
Pyrite is the dominant sulphide mineral present, occurring as widespread, disseminated, fine to very fine grained, euhedral to anhedral poikiloblastic pyrite. Pyrite occurs in all lithologies and alteration assemblages observed to date and directly correlates to gold grade.
Metallurgy
A total of 16 representative samples, representing all logged lithologies and alteration types and representative gold grades, were collected within the current pit limit. The samples were collected from distinct drill holes testing various sectors and elevations within the deposit. The samples were tested for gold recovery, gold deportment, Acid Based Accounting and ore hardness.
Diagnostic leach tests by Bureau Veritas Metallurgical Division (2022) and SGS Canada Inc. (2025) indicate gold recoveries ranging from 68% to 94.9% (average 85%).
Gold deportment studies by SGS Canada Inc. (2025) indicate that 80-100% of the gold present is native gold with the remaining 10 to 20% consisting of, electrum, gold-telluride (petzite) and gold-stibnite.
Acid Based Accounting tests by Bureau Veritas (2022), concluded the mineralization offered Net Neutralizing Potential of 76.5 kg CaCO3 per tonne, suggesting acid drainage is unlikely.
Bond work index tests by Bureau Veritas (2022) indicate an ore hardness of approximately 20 kWh/tonne.
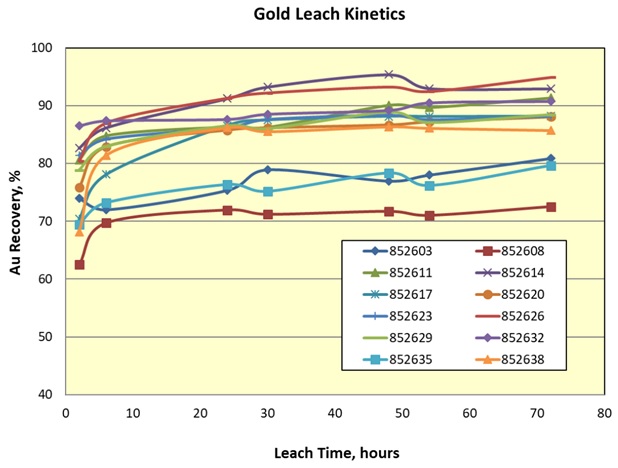
Figure 2.0 – Gold Leach Kinetics – Tower Mountain
Risks and Opportunities
The Property is located in Ontario, Canada, a geopolitically stable jurisdiction with established mining laws and regulations.
The Property is located within 40 kms of a major population centre.
The Property is in the traditional territories of Fort William First Nation.
All critical infrastructure to support exploration, development and operation is in place.
The main east-west highway, rail and power corridors are 3 to 5 kms north of the Property boundary and future open pit development does not require relocation of the existing infrastructure.
Initial Acid Based Accounting (“ABA”) tests indicate the mineralization offers Net-Neutralizing Potential (“NNP”). Based on alteration mapping, most of the waste rock should offer similar NNP, reducing the risk of acid mine drainage.
NNP waste rock may be of interest to the aggregate sector based on physical properties, the Company plans specific testing of waste rock in 2026 to evaluate this opportunity.
The January 19, 2026 Estimate assumed a metallurgical recovery of 80% which is less than the 85% average returned from preliminary testing. Further testing is planned to increase gold recovery to greater than 90%.
Federal and Provincial strategy, especially with respect to east-west trade and major project permitting timelines, are evolving. Permitting timelines for major projects are being streamlined which may benefit future project development.
The Project is tracking towards a “generational” project. It is an opportunity to create, stable, long-term employment for a permanent workforce of over 1,000 employees based on similar size operations elsewhere in Canada.
Join Our Mailing List
By submitting this form, you are consenting to receive marketing emails from: . You can revoke your consent to receive emails at any time by using the SafeUnsubscribe® link, found at the bottom of every email. Emails are serviced by Constant Contact